Selected work / Project
Traffic Monitoring Dashboard
A traffic-review application bringing image and video results, reporting, observation areas, teams, and account management into one workspace. Documentation uses simulated summaries and local sample tests.
The problem
Operators need to move between selecting observation material, reviewing visual results and counts, and preparing periodic reports. Observation areas, team access and account responsibilities also need clear management, while new users need guidance for each task.
My contribution
Independent application developer, responsible for the application from initial user-flow planning through completion. This case study covers the application experience, operational workflows, reporting and access management. Planned navigation and user flows for media review, observation summaries and report preparation. Created image and video review screens with file selection, visual previews and returned results. Completed summary charts, category comparisons, period and area filters, and downloadable reports. Created observation-area forms, team information, invitations and member-list views. Created administrator screens for reviewing account roles, status and available management actions. Added a searchable user guide and replayable walkthroughs for onboarding and page workflows.
Features
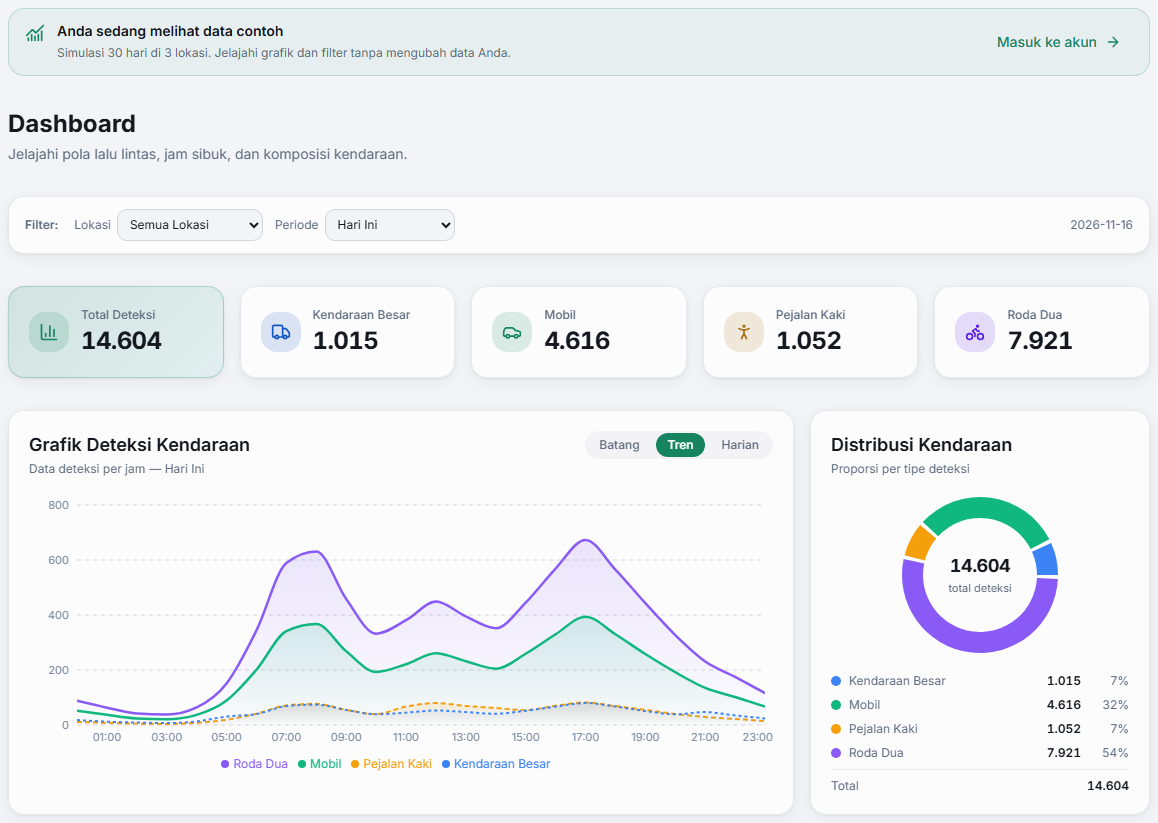
- Dashboard summaries with category proportions, time-based charts, period filters and observation-area selection.
- Image upload with an input preview and comparison between the original image and the returned visual result.
- Local video upload, preview, count review and a returned video view.
- Monitoring workspace with live and snapshot modes, documented before connecting to a source.
- Observation-area list and forms for managing area names and addresses.
- Team information, invitation controls and a member list with visible roles.
- Daily and hourly report review with filters and downloadable reports.
- Searchable user guidance, a tour library and replayable interactive walkthroughs.
- Administrator account management with role, status and account-action controls.
Scope & limitations
Dashboard and report figures are simulated; welcome-screen totals are illustrative. They are not records of actual use. Image and video screenshots show local sample tests from a cropped part of an existing recording. They do not establish traffic volume, accuracy or operational performance. The monitoring workspace was reviewed before connection. Remote media sources and live devices were not exercised. Management screens document available controls. Account, team and location changes were not submitted during this review. No real-use adoption or measured operational improvement is claimed. Selected screenshots are edited documentation copies with neutral aliases and generalized wording. Observation counts, charts, test results and connection states are preserved; captions and alternative text are bilingual.